
- August 1, 2023 2:41 pm
- Lucknow City, Uttar Pradesh, India
How to Use ADX Indicator For Day Trading | Finowings. The Average Directional Index (ADX) is a widely used technical indicator in the world of day trading.
It plays a crucial role in helping traders identify the strength of a trend and make informed buy and sell decisions.
In this article, we will delve into the ADX indicator, its formula, and how to effectively use it to generate reliable buy and sell signals for successful day trading strategies.
What is the Average Directional Index (ADX)?
The Average Directional Index (ADX) is a momentum oscillator that falls within the family of trend-following indicators.
Developed by J. Welles Wilder, ADX measures the strength of a price trend and does not provide information about the direction of the trend (upward or downward).
Instead, it quantifies the strength of a trend on a scale from 0 to 100, where higher values suggest a stronger trend.
ADX Formula:
The ADX is derived from the calculation of two other indicators, the Positive Directional Index (+DI) and the Negative Directional Index (-DI).
The formula to calculate ADX involves the following steps:
A. Calculate the True Range (TR) – the greatest of the following three values:
Current high minus the current low
Absolute value of the current high minus the previous close
Absolute value of the current low minus the previous close
B. Calculate the Directional Movement (DM) for both upward and downward movements:
+DM = Current high minus the previous high (if positive) or 0 (if negative)
-DM = Previous low minus the current low (if positive) or 0 (if negative)
C. Smooth the +DM and -DM values using a Wilder’s smoothing function over a chosen period (typically 14 periods).
D. Calculate the Positive Directional Indicator (+DI) and the Negative Directional Indicator (-DI) using the smoothed +DM and -DM values.
E. Calculate the Directional Movement Index (DX):
DX = (|+DI – -DI| / |+DI + -DI|) * 100
F. Smooth the DX values using Wilder’s smoothing function over a chosen period (typically 14 periods) to get the final ADX value.
How to use ADX Indicator for Day Trading:
A. Identifying Trend Strength:
When the ADX value is below 25, it suggests a weak or non-existent trend. In such situations, day traders might consider avoiding trending strategies and opt for range-bound or mean-reverting approaches. On the other hand, an ADX value above 25 indicates a strong trend, providing a green signal for trend-following strategies.
B. Generating Buy/Sell Signals:
ADX Crossovers: When +DI crosses above -DI, it signals a potential bullish trend, implying a buying opportunity. Conversely, when -DI crosses above +DI, it indicates a potential bearish trend, prompting a sell opportunity.
ADX Level: When the ADX value is rising above 25, it signals the strengthening of a trend. Traders can wait for the ADX to reach higher levels, such as 40 or 50, before considering trend-based entries to filter out weaker trends.
ADX Strategy:
An effective ADX strategy involves combining the indicator with other tools like moving averages or Fibonacci retracements.
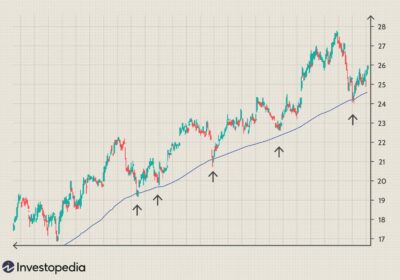
For instance, traders can use ADX in conjunction with the 200-day moving average to identify long-term trends and plan their trades accordingly.
Additionally, utilizing ADX with Fibonacci retracement levels can help pinpoint potential reversal points in trending markets.
Overview
- Category: Stock Market Trading / Advisory Services
- 77 views
- Add to Favourites
- Report Abuse
-
Share this Ad:
Seller Information
Please login to view the seller information.
Business Hours
| Open | Close | ||
|---|---|---|---|
| Monday | Open (24 Hours) | ||
| Tuesday | Open (24 Hours) | ||
| Wednesday | Open (24 Hours) | ||
| Thursday | Open (24 Hours) | ||
| Friday | Open (24 Hours) | ||
| Saturday | Open (24 Hours) | ||
| Sunday | Open Today (24 Hours) | ||
Location
Related Ads
Best Stock Broker in India
- 4 months ago
- Noida City, Uttar Pradesh, India
- 44 Views
Stock Market Educational Tips
- 6 months ago
- Bengaluru East, Karnataka, India
- 77 Views
Trends in Indian Stock Market | Finowings
- 7 months ago
- Lucknow City, Uttar Pradesh, India
- 59 Views
Zerodha Account Opening | Finowings
- 7 months ago
- Lucknow City, Uttar Pradesh, India
- 60 Views
3 Tips For Beginner Stock Traders To Level Up with Top Tools
- 7 months ago
- UK
- 58 Views
Upstox Account Opening Documents | Finowings
- 10 months ago
- Lucknow City, Uttar Pradesh, India
- 47 Views
Dow Theory in Technical Analysis | Finowings
- 10 months ago
- Lucknow City, Uttar Pradesh, India
- 58 Views
Learn and Master The Stock Market with Our Online Trading Game | Bullspree
- 1 year ago
- Ahmadabad City, Gujarat, India
- 72 Views
Best Crypto Trading Platform in India Grow New Business
- 1 year ago
- Karol Bagh, Delhi, India
- 117 Views
Best Crypto Trading in India with Low Fees 2023
- 1 year ago
- UAE
- 162 Views
Is It Worth Investing in The BVG India Share Price?
- 1 year ago
- Gurgaon (Gurugram) City, Haryana, India
- 87 Views
Is It Good To Do Investment in Assam Carbon Pre IPO Shares ?
- 1 year ago
- Gurgaon (Gurugram) City, Haryana, India
- 107 Views
Is It Good To Do Investment in Bira Share Price ?
- 1 year ago
- Gurgaon (Gurugram) City, Haryana, India
- 152 Views
Are You Investing in CSK Unlisted Shares ?
- 1 year ago
- Gurgaon (Gurugram) City, Haryana, India
- 102 Views
What is Unlisted Share Price of Sterlite Power?
- 1 year ago
- Gurgaon (Gurugram) City, Haryana, India
- 117 Views
Invest in Bira Pre IPO | Planify
- 1 year ago
- Gurgaon (Gurugram) City, Haryana, India
- 115 Views
Buy and Sell Signify Innovations IPO From Planify ?
- 1 year ago
- Gurgaon (Gurugram) City, Haryana, India
- 82 Views
Start Investing in Five Star Business Finance IPO – Planify
- 1 year ago
- Gurgaon (Gurugram) City, Haryana, India
- 125 Views
Is Investing in The Bikaji IPO Worth It – Planify
- 1 year ago
- Gurgaon (Gurugram) City, Haryana, India
- 98 Views
Is Investing in The Five Star Business Finance IPO Worth It – Planify
- 1 year ago
- Gurgaon (Gurugram) City, Haryana, India
- 97 Views
Low Cost Algorithmic Trading Software By Angel One
- 2 years ago
- Pune City, Maharashtra
- 191 Views
Get Forex Training in Chennai | LITHUFOREX
- 2 years ago
- Chennai - Ambattur, Tamil Nadu
- 190 Views
Earn Money Daily 1-2k From NIFTY & BANKNIFTY Option Trading
- 2 years ago
- Siliguri, West Bengal
- 166 Views
Trade & Invest Online in Stocks with SAMCO
- 2 years ago
- Mumbai - Aare, Maharashtra
- 154 Views
First Test Then Pay For My Work – TRADING CALLS
- 2 years ago
- Adarsh Nagar, Delhi
- 165 Views
Learn About Mutual Funds, Banking, Stock Market – Market Milestone
- 2 years ago
- Bhopal City, Madhya Pradesh
- 150 Views
How Can I Buy Hexaware Unlisted Shares on Planify
- 2 years ago
- Gurgaon (Gurugram) City, Haryana
- 194 Views
Nirmam Business Opportunity – Partner with us as a Sub Broker
- 2 years ago
- Bhopal City, Madhya Pradesh
- 140 Views
Future Trading | Stock Market Calls | Share Broker in Bhopal
- 2 years ago
- Bhopal City, Madhya Pradesh
- 163 Views
Today Sensex | Best Broker For Demat Account | Nirman Broking
- 2 years ago
- Bhopal City, Madhya Pradesh
- 164 Views
Best Online Stock Brokers in India
- 2 years ago
- Indore City, Madhya Pradesh
- 207 Views
Brokerage Calculator – Discover True Cost of Equity Trade | GWC India
- 2 years ago
- Chennai - Mylapore, Tamil Nadu, India
- 209 Views














You must be logged in to post a review.